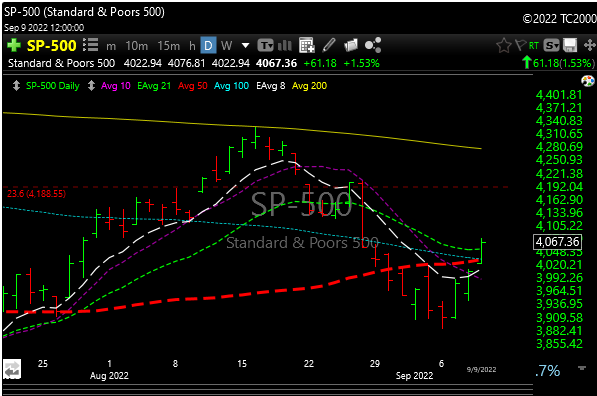
The S&P 500 has closed below its 200-DMA for more than 100 trading days now – the longest streak since the Financial Crisis
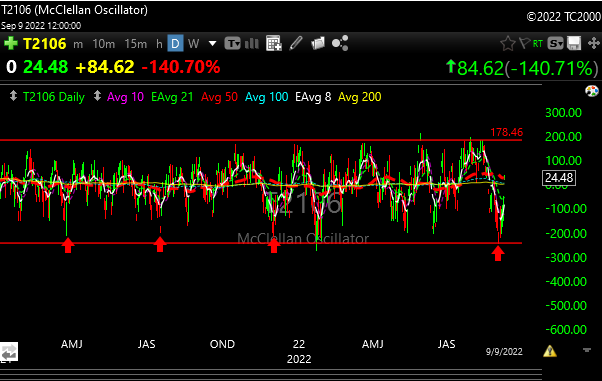
I posted the McClellan Oscillator last week, my favorite overbought/oversold indicator and it was on the money again. The red arrow support zones acted as a buy signal once again.

The stock market rally extended recent losses on Tuesday, but then rebounded for strong weekly gains.
The Dow rose 2.7% last week. The S&P 500 index popped by 3.65%. The Nasdaq jumped 4.1%. The small-cap Russell 2000 rallied just over 4%.
The 10-year Treasury yield rose 13 basis points to 3.32%, the sixth weekly advance and close to June’s 11-year high of 3.48%.
U.S. crude oil futures hit their lowest levels since January during the week but rebounded to finish down just 0.1% at $86.79 a barrel. Natural gas futures tumbled 9%.
ARKK popped 9.9% last week.
On Tuesday, the stock market rally appeared to be on its last breath. The major indexes were starting to lose sight of their 50-day line after tumbling back from the 200-day line in mid-August. The Nasdaq undercut late July lows, but notably, it did not close below that area.
From there, the major averages rebounded.
It wouldn’t take much to have the indexes tumble back below the 50-day line and revisit last week’s lows. On the upside, the 200-day moving average is still a huge test above for all the indexes.
I’ll be watching Nazzy closely next week. The SPX had a nice close above its 50-day moving average. The Nazzy closed 10 points above its 50-day on Friday. NDX closed at 12,588. The next target could be 12,860 then the 13, 200 zone.
That’s a big “if”, but momentum can be an amazing thing even if you think the market should fundamentally be trading lower.
I’m seeing a ton of good setups again. A few solid ‘up’ days will usually do that. If they don’t “bull trap” us here, maybe we could see some legs out of this rally.
Last week’s rally was a nice relief, but I still maintain that the bottom is not in, so stay safe out there. If you buy stocks to put in a sock drawer you’re OK, you can forget about it, but shorter term, it really is up in the air as to where we may be in a week or two.
Sometimes, there’s a chart that just blows your mind. Not many charts stand out like this one. Last week, institutional traders bought $8.1 billion worth of put options. They bought less than $1 billion in calls. This is 3x more extreme than 2008.
From Sentiment Trader
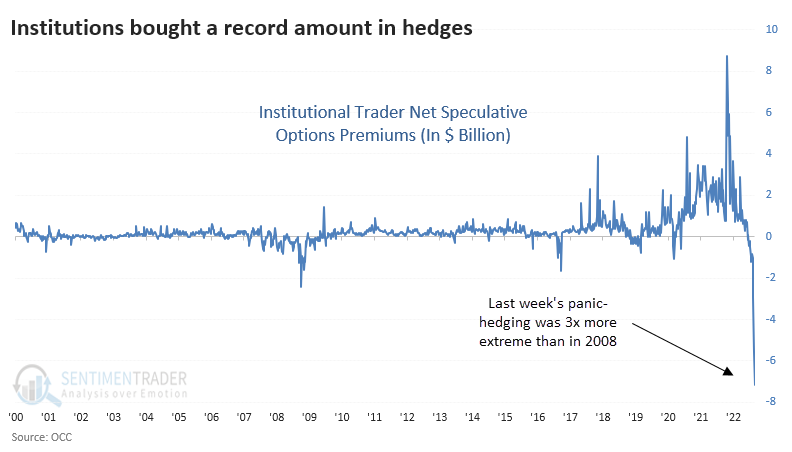
We are definitely still in bounce mode. Once again, the crowd got too bearish at the bottom. The big question now is if this bounce will morph into a real squeeze like the one we saw this summer.
“The Pain Trade Is Now Up, The CPI Doesn’t Matter At All, And The Q4 Chase Starts Early.” -Goldman Sachs
I guess we will see. Everyone has an opinion. Good luck next week.
Still, a lot can go wrong and I think a lot of it will be with higher energy and food prices going forward.
SETUPS
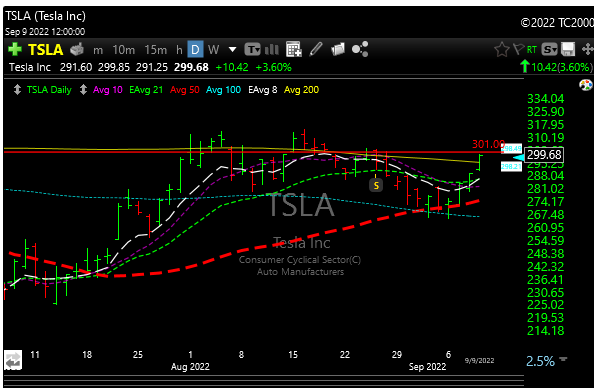
TSLA– This is a first for me but the chart looks great. I will trigger this through $301. Stop 285
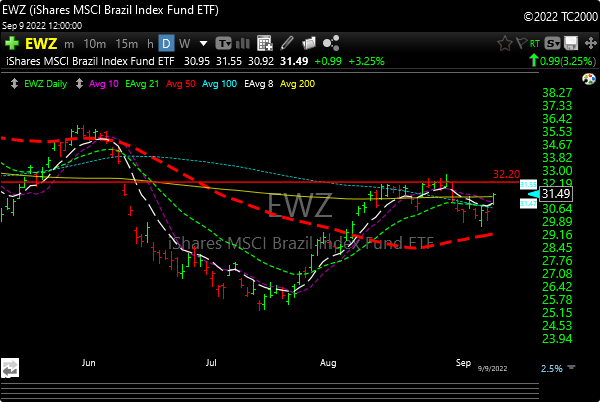
EWZ (Brazil)- Trigger price 32.20 Stop area 29
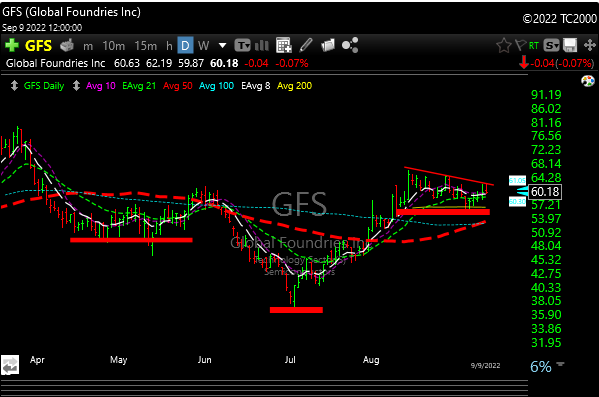
GFS -Trigger $62.50 Bullish inverse H&S. Stop area
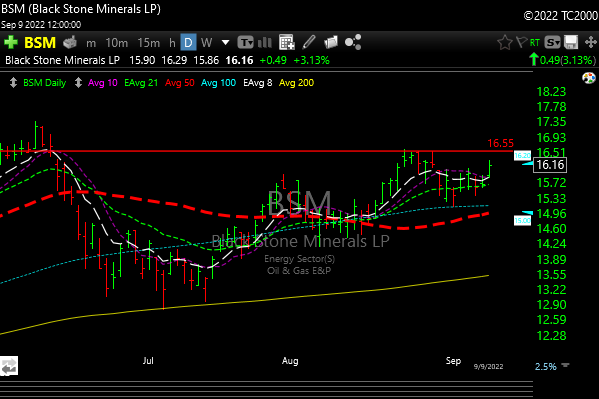
BSM– Trigger at 16.55 Stop area 15.25
A stock quotation room where workers would answer stock quotes in under 60 seconds (1943)