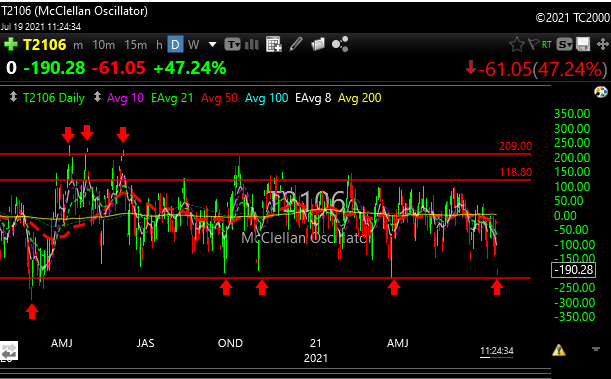
The McClellan Oscillator, my favorite overbought/oversold indicator is at a spot where short-term bottoms can happen.
As you can see in the chart above, rallies occurred the last three times around this level.
If you look all the way left though, you can see that it did dip lower back in March 2020 area. That was the COVID low.
So we “may” be near a bottom, but we are still in knife-catching territory so be careful.
SPX landed almost to the penny at its 50-day moving average and bounced.
One possible long here is AMD which has good action considering.
