Dow: +217.08…
Nasdaq: +184.61… S&P: +47.05…
I wanted to show you a little thing called “pattern recognition. It simply means that charts setup similarly, sometimes identically to past setups. Often times the result is the same, up or down.
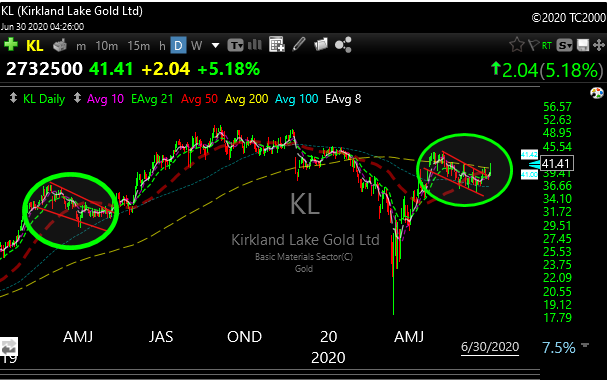
I’m doing a lot more work on the gold and silver names but I wanted to show you the setup on KL which we have been talking about recently.

Notice the bullish falling wedge on KL back in March/April of last year. This is when we started to add a lot of gold and silver stocks. Feels like ten years but its only been over a year. Hopefully, their performance can repeat.
Anyway, the wedge on the left (March/April 2019) is almost identical to what I’m seeing now. See the green circle on the right. Another bullish falling wedge.
When it broke out of the first wedge in May of last year the stock went from around $32 to $51 in about 4 months.
The setup here is the same, so I would at least look at that $50 level as a target 3-6 months out. Maybe sooner if rates and the dollar implode.
Just an observation, but I am seeing a lot of patterns in this space that are repeating.
I didn’t add any to the P&L today because I wasn’t a huge fan of chasing breakouts at quarters end and I’m waiting for a little pullback in the metals.
Hopefully they pullback just a bit, if not I’ll just bite the bullet and get long.
SIL, KL, SLV, GOLD, AGQ, PAAS, GLD
P.S. TSLA is up 55% since Elon Musk said his stock was overvalued on May 1.
