{+++} This market is like death by a thousand paper cuts. Today the Fed was obtuse at best about where the direction is, and the market did what it usually does after the announcement. It acted like a can of crazy, as it sold off, went up hard, then proceeded to roll over pretty hard.
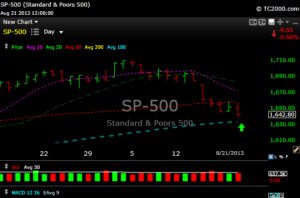
Below is a daily chart of SPX and it sure does look like it want to go test that 1630 area which is the 100 day moving average. The Dow Jones has been down 5 or 6 days in a row and the technicals are getting oversold to the point where you probably have to take a shot long soon.
The relative strength index (RSI) is 25 on the Dow. Usually you can be a buyer at a level around 30. We’ll see tomorrow if it gets an oversold bounce or stays oversold. The SPX RSI is around 35
S&P futures are currently at 1632 down 4 handles from the 4:15 close
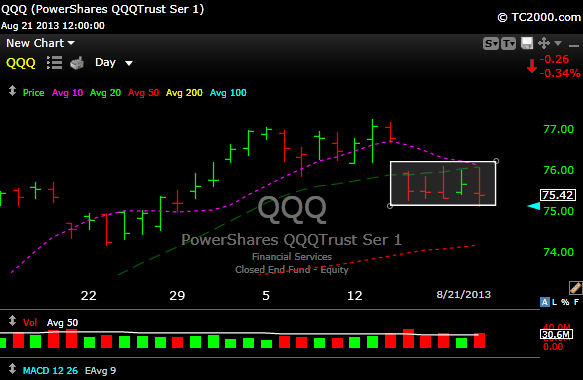
The Nasdaq QQQ has been going sideways for 4 days now. See the box on the chart below. If it breaks down form that box, than look for the 50 day moving average to be the next support.
Actually I”m looking at the 100 day moving on a lot of things for support now. XLF would be one example. You may want to check your daily charts and also watch this level on some of your stocks.
I’ll see you guys in the morning.


