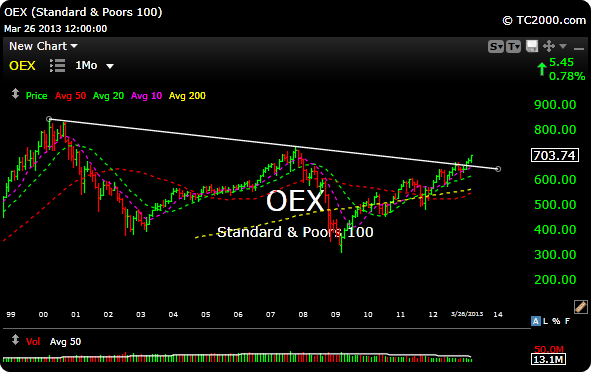
As the S&P finds itself about 13 handles away from ts all time intraday high, the S&P 100 ($OEX) finds itself light years away from its all time high.
The S&P 100 put in its top on March 31, 2000. The Nasdaq 100 ($NDX) also put in its all time high on that same day. Many remember the glory days of the tech bubble and the subsequent top and its magnificent crash. It always fun when a two hundred dollar stock trades down to a buck.
The S&P 100 hit a high of 846 that day, it closed yesterday at 703.
If you look at the monthly chart at the top, you you can see that in January, the S&P 100 broke out of a downtrend that was in place from 2000.
This wont make you money, but I found it interesting. We all spend a lot of time watching the S&P 500, that we don’t look at the S&P 100. You can analyze this a few different ways, but I see it as bullish.


