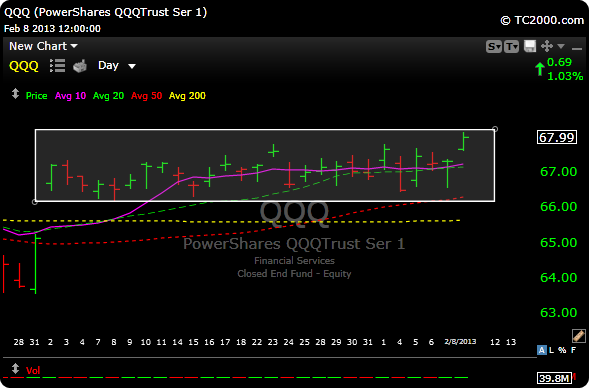
The $QQQ (above) has been in this five week long consolidation since its big December 31 pop. The ETF also followed through to the upside on January 1. I’ve been watching this closely, as a move above and out of the the box with volume may indeed get this going higher. Of course everyone is waiting for it to fail around this level, as the consensus is that “we are overbought”. I lean cautious here too and think a pullback would be healthy.
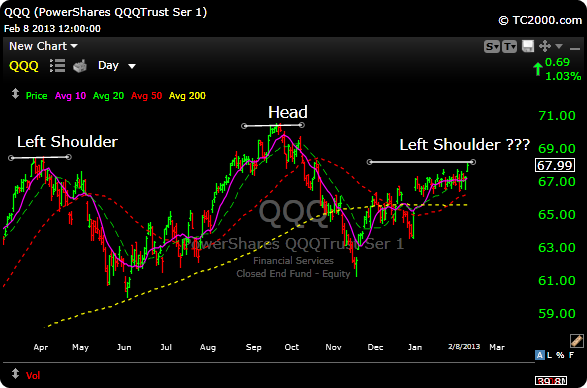
If you stretch out the daily chart of the $QQQ, (below), you can see why some may be warning of a potential right shoulder of a “possible”head and shoulder” pattern. A move above and out of the box would probably negate that bearish outcome.
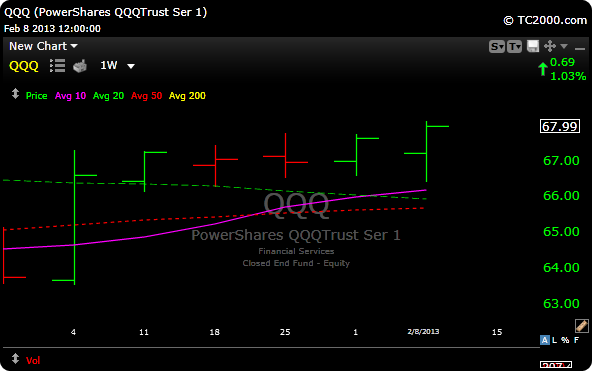
Now let’s get really confused. If you stretch the weekly chart of the $QQQ you can make the case for a pretty bull flag. Watching the charts is a fun exercise, but it is no guarantee of an outcome that you may want, it’s simply a guide. Many head and shoulder patterns never validate, many never break the neckline.
Anticipating a top or a bottom can be disastrous, so the best thing to do is wait for the indicators to really turn in one direction before playing anything too long or too short.. If this does start to roll over, my play will be $SQQQ. However I still think pullbacks will be fairly shallow and buyable, barring any hidden mini disasters.
Take a Free Trial here


