There are many sectors to look at, but because we are experiencing a new “run into funds” I thought I would look at the charts of some of the asset managers. That’ where the money is flowing as we get ready for…the next big leg up?
Personally, I think that you don’t need funds in a good market, and in a bad market they will kill you, but if inflows continue, these guys will make money by accident.
This may finally be the year that the bond bears are right, as Bernanke & Co, will finally force everyone out of the safety trade that is fixed income. $TLT is still my favorite short for 2013. If the financials are dong better now, just wait for rates to tick up, so they can really make money on spreads. Until now, they’ve been doing it with smoke and mirrors.
The recent piling into stock funds — $18.3 billion in the past two weeks, the most since 2000 — indicates a riskier approach to investing from retail investors looking for yield. This is usually more than a blip and more of a sea change, so you have to take it seriously.
So where does this money go? It goes to asset managers. I am not looking at the money center banks here (they’re going higher too) , but more the asset guys. Money will find these name over the next year, and faster when the bond bubble does finally burst. Interestingly, many of these funds have been cleared to launch ETFs or are working with the SEC to do so. These aren’t “flips”, but names I will be looking to hold. Stocks like $BLK have already had massive rips, so chasing is dumb. Here is a look at some of them.
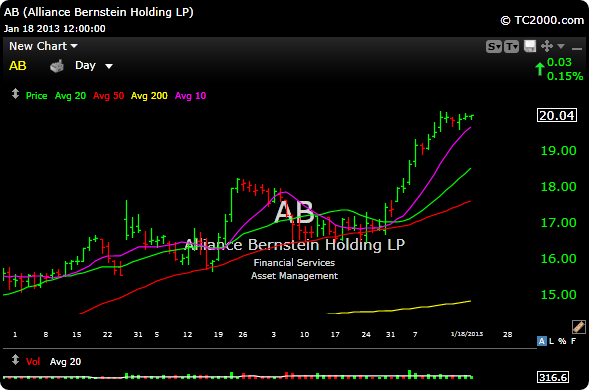
$AB is working a nice little flag on the daily, but is right up against 200 day sma resistance on the weekly chart. This stock was in the 90’s before the crash in 2008. Volumes are improving, look for a breakout, with volume around the 20.20 level. Here is a look at the daily chart.
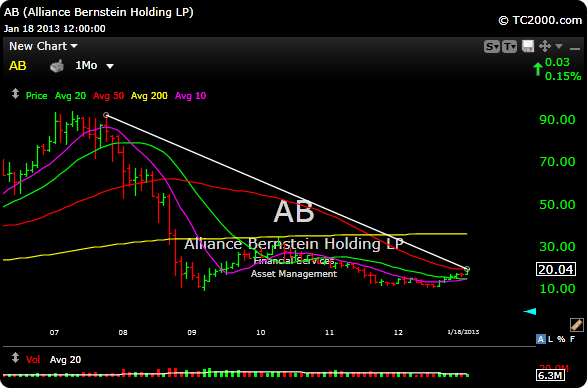
Here is a look at the monthly chart for $AB, if the wind blows the right way for this tape, there is much upside.
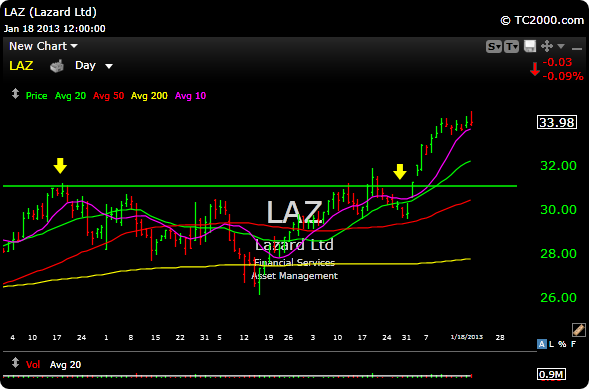
$LAZ had a big breakout through lateral resistance (green line and yellow arrows) earlier in the month. It’s a little extended and may need to come back to retest the breakout area around 31
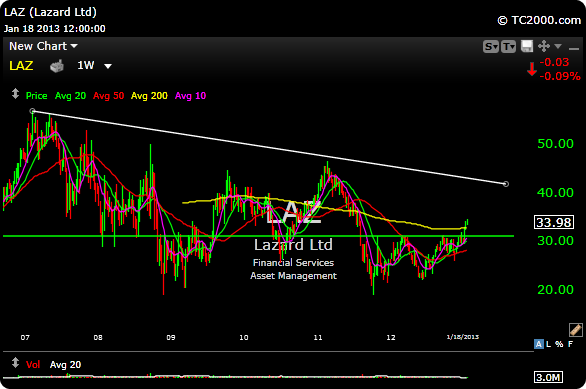
Here is a look at the weekly chart. As you can see, it has broken above and is holding above the 200 day moving average(yellow line). A move to the weekly downtrend line around 42 is doable.
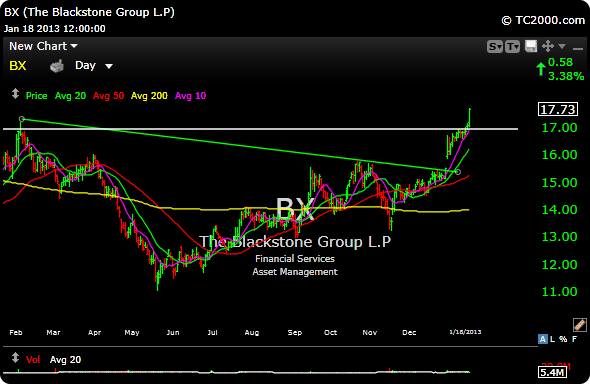
$BX broke out of downtrend resistance (green line), but blew through lateral resistance on Friday. This was a 40 dollar number back in 2008. Stock looks higher.
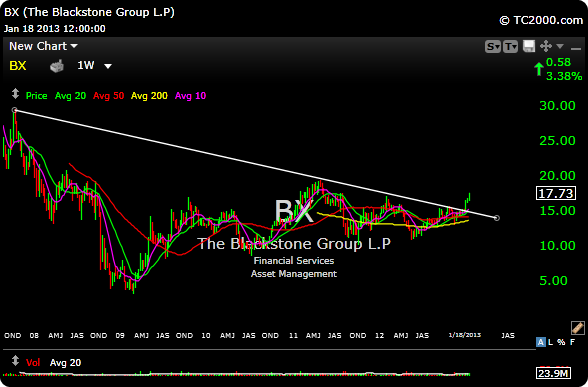
Here is the $BX weekly view. You can see that it exploded above the weekly downtrend line that goes back to 2007. Technically significant.
Stocks like $BLK and $TROW are extended and are at, or very close to their 2007 highs. So avoid here and wait for pullbacks. You can argue that the the retail investor is out of the market forever, but the “greed” and the “missing out” dynamic can be powerful emotions.
Based on this recent market action, you have to go deep into the jungles of Burma to find a bear, so I think this market is ready for a little break, so watch these names on any 3-5% pullbacks for entry. The financials should do very well this year, even though they have had a nice move already.
You can receive a free trial here and click here to view January subscriber performance.
Have a good week

