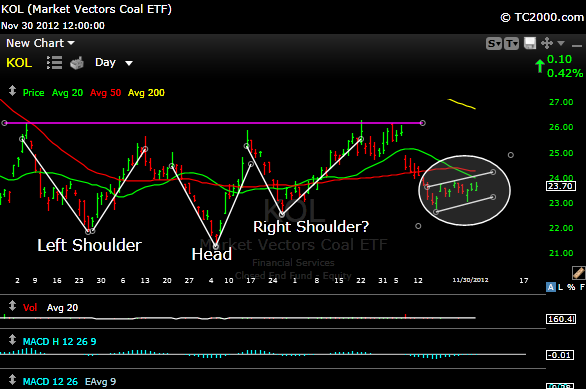
I was optimistic on coal. Made money in the trade as I bought them when nobody wanted them. Then the election happened. I drew this $KOL chart below a couple of months ago. I bought when the right shoulder of that inverse head and shoulder started turning up. It was an anticipatory trade and it worked. Head and shoulder patterns (inverse or not) mean squat unless the neckline gets breached. As you can see (magenta horizontal line) it never did. Money was made, but the “real money” wasn’t.
The election happened right at the neckline, and all hell broke loose to the downside. As you can see on the far right of the chart (the circle), the $KOL chart is now in a bear flag which may or may not break lower.
The pullback has been tough, but at some point they will be worth revisiting, so lets look at the charts.
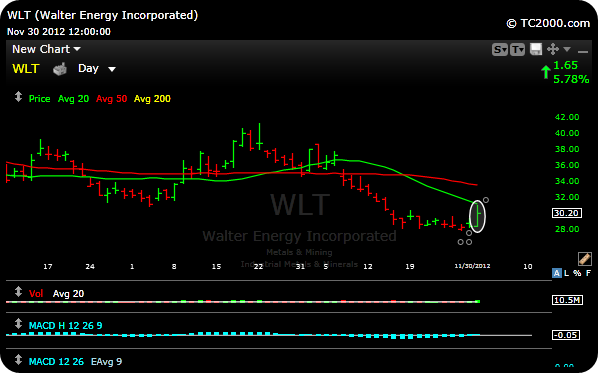
$WLT has been crushed, but held some daily support on Friday, helped by its 13,000th takeover rumor. The stock had great volume and got stopped at its 20 day moving average resistance on Friday. It’s worth keeping an eye on this one. I don’t have much interest until it gets back over the 50 day moving average.
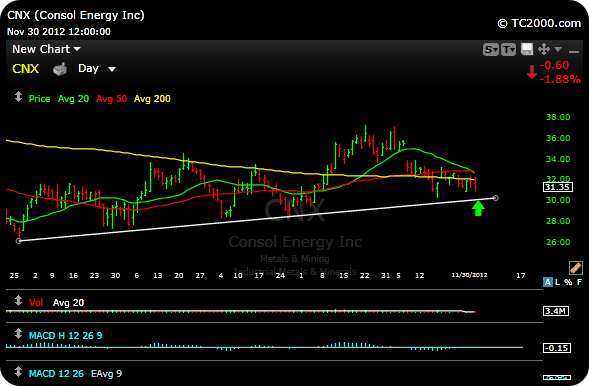
$CNX has coal and nat. gas. As you can see, it has always successfully tested its uptrend line and bounced. You can try a long side trade at the white line with a tight stop underneath.
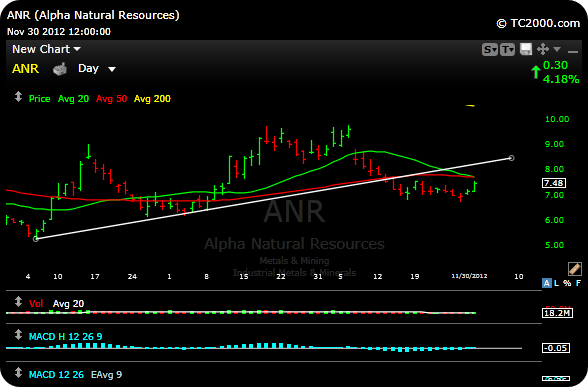
$ANR broke its uptrend line, but is now up against 20 and 50 day moving average resistance. No trade unless sit can get above there and hold.
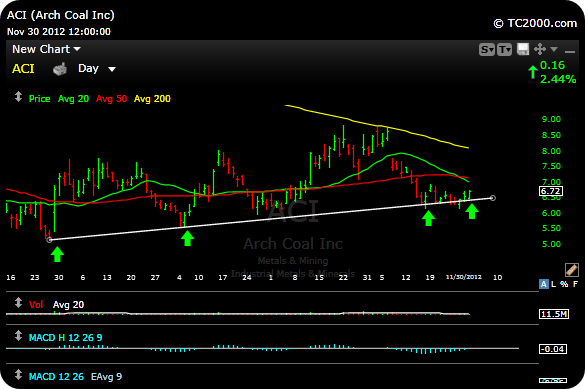
$ACI was hit hard, but as you can see it is bouncing along uptrend line support for the most part. A break down through the line “may” bring it back to 5.
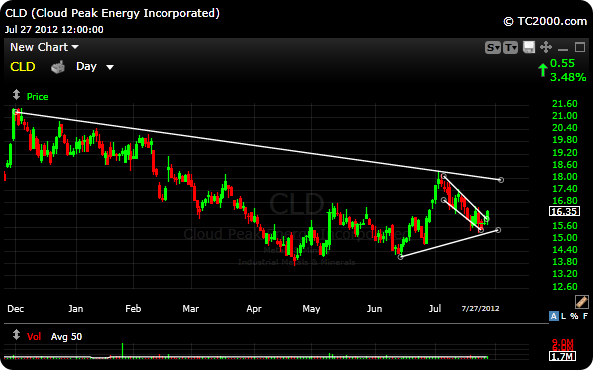
$CLD is trying to hold its uptrend as well. If it cant manage to hold, there will probably be retest of its 200 day moving average around 17.
Bottom line: These can all be longs here with tight stops below, but as always, its all about your time frame.
Come by for a free trial here.


