$AAPL and $GOOG are both trying to make up for some lost time over the course of the last couple of months. Both topped back in late September and early October. Both remain phenomenal stocks and are the defacto leaders in their space. Let’s look at the charts.
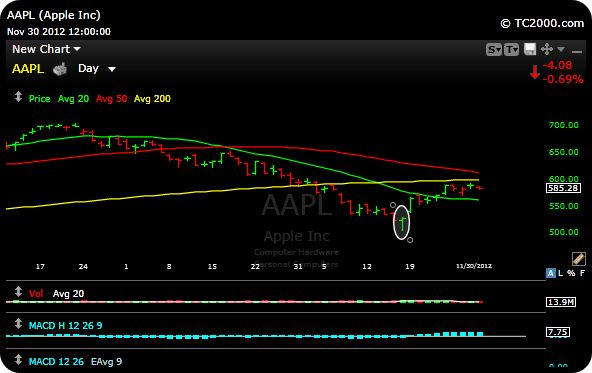
As you can see in the chart below, $AAPL sold off almost 200 points from 9.21.12 to its bottom on 10.16.12. That move down took about 35 trading days. It was fast and violent. As you can see in the circle on the chart, the stock put in what I thought was a bottoming candle on 11-16. That was an important candle and was a “tell” for what was to come. Although that candle was important, it would probably have meant nothing unless we saw a firm follows through day. Well that candle was put in on Friday, and as you can see the stock confirmed on Monday by exploding almost 30 points. It was a playbook bottom.
Right now, $AAPL is again trying to grind higher as it consolidates its big rebound. Going forward, the key levels to watch are 600.11 (the 200 day moving average) and 613.18 which is the 50 day moving average which sits just above.
This is a technical view, but what would go a long way in lighting AAPL’s candle from a fundamental standpoint would be a special dividend between now and year end, Probably good for +25-30 bucks in my opinion.
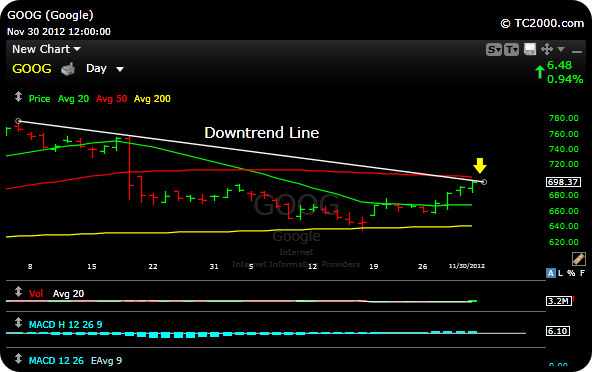
$GOOG got pulverized back on October 18 after a disappointing earnings report. You can see that big red bar on earnings day, it then created a bear flag fro about ten days, then broke lower (which usually happens after a bear flag). That second break lower took it from about 670, to the the 200 day moving average, where it finally found support. That move was about 30 more points. I love 200 day support levels and use it a lot as a place to get long, both on the daily charts and my 10 minute. I call it my money zone. More often that not, it is great place to start a long position.
Anyway, $GOOG is at an interesting spot now. The stock had a great week last week, as it rallied almost 40 points. As you can see, it traded to its downtrend line on Friday (white line) and just under its 50 day moving average. Bottom line, there is some resistance here, so this could go sideways for a bit before it moves higher.
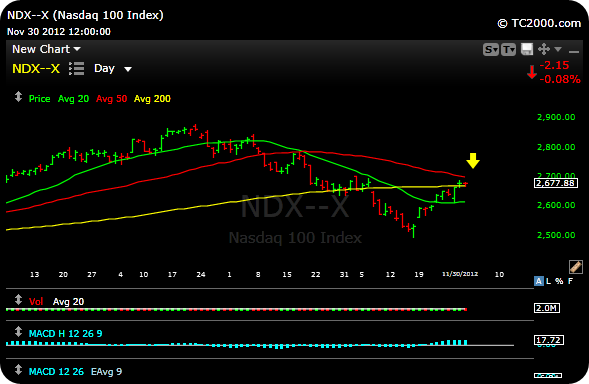
To wrap things up, the Nazzy has had a nice rally off the lows. Sideways is good for now until (if) there is another leg up. As you can see below, the Nasadaq 100 is slightly above its 200 day and just under its 50 day moving average.
$AAPL and $GOOG will be key to what happens next.
If you found this post helpful, come on by and take a FREE TRIAL to my site. Good trading.
P


