I’m showing the weekly charts for the coals this week because I think that view going forward is more telling than the daily chart. If you’re long coal you have to be asking yourself, “is it different this time”? I am a longer term holder in the sector, (see past blogs on coal) not trading it, even though some of the moves on Friday were in the +17% range.
I remember back in late June, the pundits basically said oil was going to zero because of ample supply and light global demand. Oil had come down from 115 to 77. Crude is now 96 and many, if not most of the energy stocks, have rallied 30-50% over the last several months. So much for smart money.
The herd has been so wrong for so long in this tape, it has almost become comical. This has been the most hated, and “unbelieved” rally ever. This is probably why we will go even higher. The hedgies have been chopped up and frustrated like you and I, and they will need to play catch up these last few months, as so many of them have not kept up with the S&P this year.
No one rings a bell at the bottom, yet many waited for the “all clear”. There is never an all clear in the market, but while everyone was under their desks waiting, ETF’s in Europe ( $EWG, $EWI, $EWP and $EWQ ) quietly rallied 30-50% over the last six weeks. The euro ripped from a short squeeze and the dollar has declined about 5%. Those nasty 10 year Spanish yields have dropped from 7.5% (DEFCON 1, remember?) down to the 6 range. Everyone waited for the correction that really never came.
Yes, we are short term overbought,but, get ready for the cliche….we can stay overbought.
Anyway, back to coal. I’m not sure if this time is different, but the charts do help, so lets take a look.
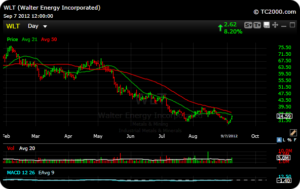
$WLT made a new yearly low on Wednesday, but it was an interesting candle because it shoes a possible bottom. It also had two very impressive follow through days on Thursday and Friday. The MACD is still flat on the daily and weekly, so look for that to try and turn up. The daily 20 day sma is 35.27 . The daily 50 day is 36.70.
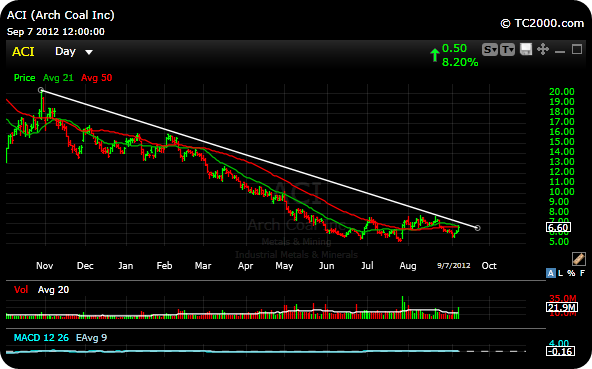
$ACI had a phenomenal day on Friday, up over 8%. The stock broke above the daily 20 day MA but couldn’t manage a close above it. it did close above the 50 day MA though. As you can see it almost touched the weekly downtrend line which is big resistance. If things go the right way though, it could explode higher, this could also be a fail spot. The 7.70 level would be a massive breakout, so it still has some work to do. Watch volume.
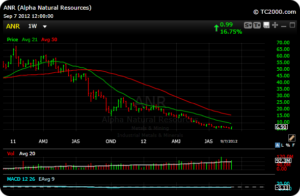
$ANR exploded for about 17% on Friday. Ridiculous. It closed above 20 day MA on the daily, but stopped right at the 50day MA daily. The weekly chart has the 20 day sma up around 9.39. Friday’s volume was enormous which is very bullish.
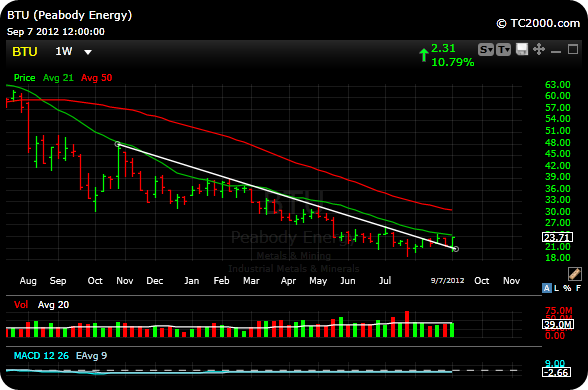
$BTU popped about 11% Friday, also accompanied by great volume. It has broken out of the daily and weekly downtrend and the weekly 20 day MA is 24.27, the 50 day is 30.73. Looking better for sure.
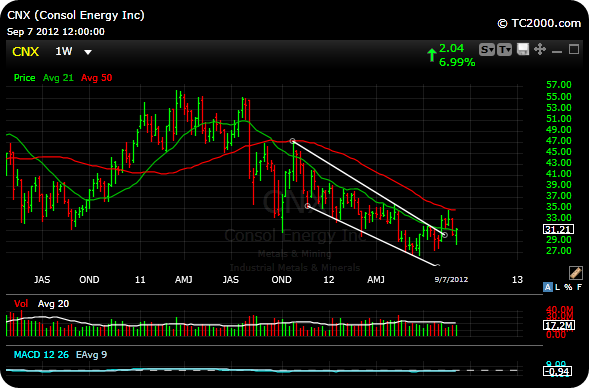
$CNX is the two headed monster that has exposure to natural gas and coal. Could trade to 34-35 short term if this coal move continues. It was up over 7% Friday.
$CLD broke out above the 50 day weekly moving average on Friday. The stock was up 4%. Low cost producer that could tag 21-21 in a better coal tape.
My subscribers have enjoyed excellent returns on my Premium Site. If you would like to request my performance up to the close of trading Friday, just email: [email protected] or subscribe here.
Short term trades that we monetized last week included: $LULU +15%, $LNG +13.5%, $LVS +5.0%, $GDX +13.5%, $TPLM +26.0%, $VRX +15%, $UYM +6.4%, $CELG +5.6, $THLD +15.5%. No losers were taken.
Have a great weekend.


