{+++}
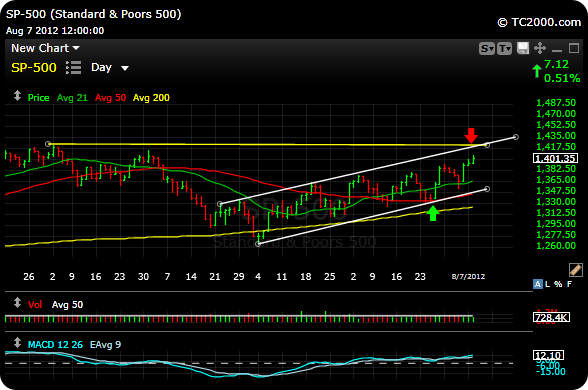
I wanted to go over a few charts and discuss a little bit about where we could go short term. If you remember the chart below from Friday night (below) where I talked about the SPX (which is the cash S&P).
It does look like the S&P may want to test the upper part of the channel (also the May highs) and maybe tag the 1420 level (red arrow just below). We’ll see, as we are overbought, but could stay that way for a while longer. Always be on guard for a sudden correction.

As you can see on the chart of the QQQ, they have already broken out of the upper part of the channel (red arrow) and could actually trade up to the green arrow which is also its early April highs.

The market looks and feels higher and many charts are turning up technically on their weekly charts which is very bullish, but we all know the market can make you look stupid when things look perfect.
With that said, charts still look great, so here are some long sets ups to chew on for the rest of the week.
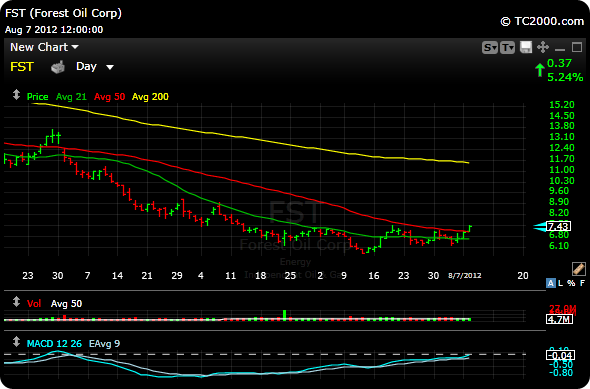
FST- Forest Oil is breaking above the 50 day moving average on the daily chart. There is some resistance at the 7,50 level, but a break through could measure a move to 9-9.50

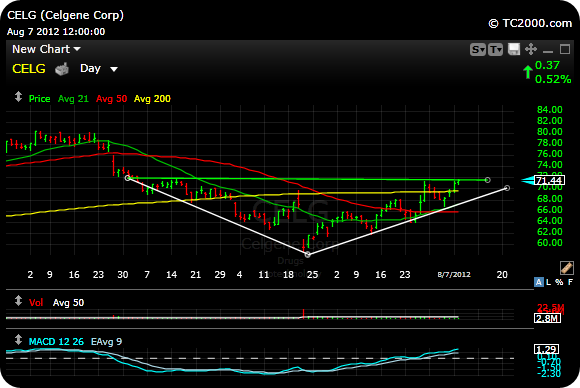
CELG-Celgene is at lateral resistance and a move above the green line could take it to the 74-76 level

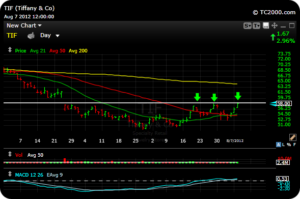
TIF- Tiffany is now above the 50 day moving average and the 20 day is actually crossing up through the 50 day which is bullish. There is a gap fill at 60, but may have legs to 63.

Good luck and I will see you guys in the chat room tomorrow. Don’t forget to go to the P&L tonight to view the entries and stops on these new additions.
P.S. Coal is looking good and some of the technicals are really starting to look more bullish. ANR reports in the morning.
