“The only difference between a tax man and a taxidermist is that the taxidermist leaves the skin”.– Mark Twain
The S&P broke its 10 and 20 day simple moving average support lines last week. The uptrend is still firmly in tact, but the punch bowel was taken away as the market digested the new reality of riding a two wheeler, as our monetary morphine was removed (until the next bad number). The government teet is great for stocks, but not so much when it gets pulled away. The jobs number was uninspiring and we would sitting over 10% if you take into account all of the folks who just quit looking and are wandering the boulevard of broken dreams looking for ways to reinvent themselves. This is the greatest jobless recovery since the Great Depression. Unless you think all those fast food and Dress Barn jobs will lift us from the wreckage on any kind of sustained basis.
The market’s mettle will be tested here. Can it grow organically and hold its bid without the “Great Bernank”, or will it go into hiding until we run into some bad economic numbers and a printing press reboot?
There are still some awesome looking long patterns and some names that are starting to crack, but that’s always the case isn’t it?
The $XLE names look the worst to me, and although the fertilizers are holding water, $MOS is cracking, so watch the rest of that group. Semiconductors $SMH are holding the 50 day, but a break with volume could bring them down 5-10%. The banks $XLF broke some moving averages and that ETF may need to test $15 level which is the 50 day moving average.
$MCD… As you can see, the stock successfully tested the trendline (in white) indicated by the green arrows on several occasions. However the stock finally broke that trendline on March 8 as it gapped down through support. On Wednesday the stock traded back up to the trendline, but failed. Pretty textbook. It gave it another go on Friday, but failed at the 50 day MA (red line). If it does try another move, watch that white trendline (red arrow) for another fail and a possible short entry.

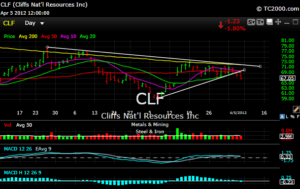
$CLF failed at the 200 day moving average and at its downtrend line. It broke its uptrend line on Thursday with a follow through lower on Friday. It also broke its 10 & 20 day MA’s last week. There is some support at a gap fill around 65, but if it breaks there look for 60.

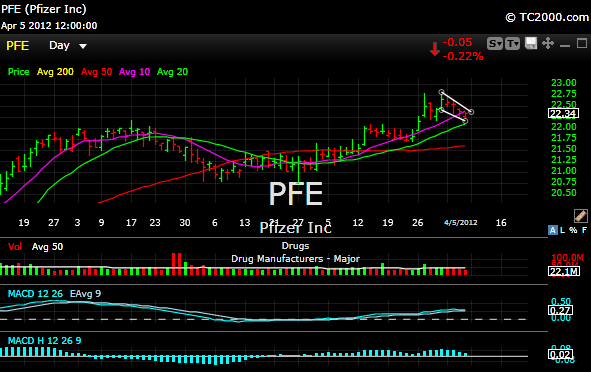
I like the drugs here especially $LLY and $PFE. I’m long both. Below is a chart of $PFE, also carries about a 4% dividend. PFE has good support at the 20 day MA around 22. Looking for mid 20’s

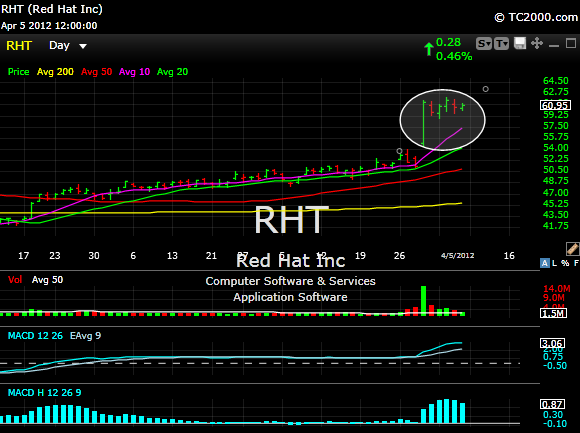
$RHT Yeah, I know this one popped 10%, but strength gets stronger as a rule. Had a chance to give up the goose in a lousy tape last week but didn’t. Watch for a further breakout over last weeks highs. Has to be good volume though, we’re seeing a lot of false breakouts lately.

$VAL I am long this one. It tried to breakout Friday (failed breakout), but couldn’t hold. Don’t buy unless it presses through Fridays high with volume. Great pattern so far.

For more daily set ups with entries and stops or to just hang out in the live chat room, you can visit the subscribe section here. Have a great weekend.

