Sometimes trend lines and moving averages work the same way. Occasionally I will draw an uptrend or downtrend line and notice that it is amazingly close to a key moving average. So on the charts below I took out the moving averages to show just the trend line. Less noise. Many times it can be more powerful. A break of a trend line can imply just that, a change of a trend.
Sometimes an uptrend line will break lower, you get all jazzed up to short it, then it whips higher for a day or two. The “street” will overthrow the trend line to shake people out, squeeze your short, only to kill it a day or two later.
Stocks that break an uptrend line with volume can be great shorts. Here are a few basic examples.
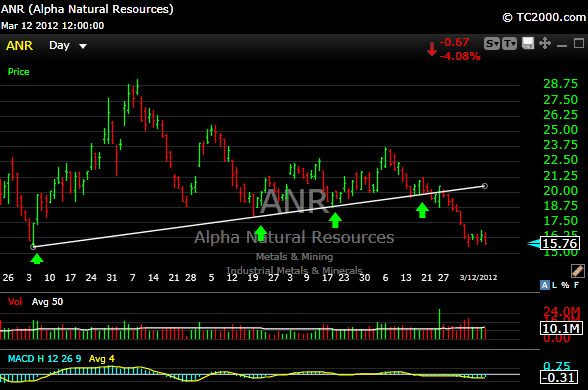
$ANR is a good example of a stock that did a great job of holding its uptrend line….until it didn’t. As you can see 0n 2/22 it finally broke and closed below the uptrend line, but rallied hard the following two days. The stock didn’t hold, and was good for five quick points to the down side.

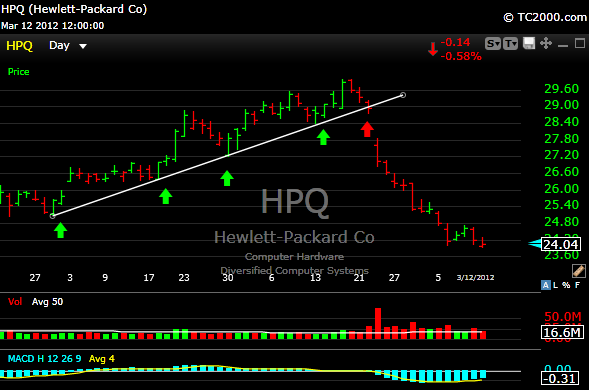
$HPQ successfully tested its uptrend line four times before the lights went out.

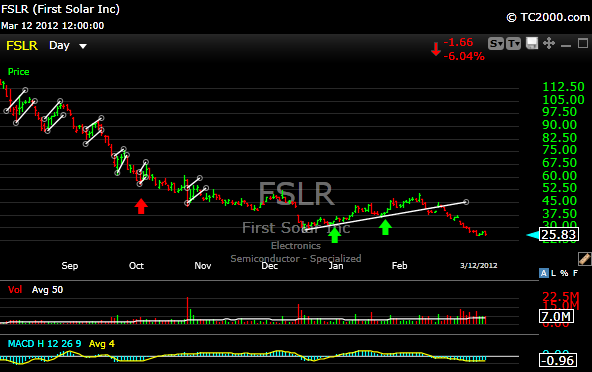
$FSLR has been a waterfall of bear flags since back in August. It broke its recent uptrend line though in late February. That’s all she wrote.

Those are just a few examples. This is very basic stuff, but if used properly it can save or make you some real money.
