Some ugly data sent stocks spiraling lower Thursday. The selloff slowed when the stock market approached its monthly low, though. After the close ARO, BCSI, CRM, DELL, GPS, HPQ and MRVL reported earnings.
All ten sectors were in negative territory, led by financials (-2.4%), materials (-2.2%) and industrials (-2.1%).
Tomorrow morning, no economic reports are scheduled to be released before the open:
My most hated group of fake stocks, the financials, took it on the chin today and tanked about 2.5%. We always talk about the financials and at times love being short the sector, but I bet some of you don’t know the actual weightings in the Spyder ETF which as you know is XLF. We always play the XLF short via FAZ. So here are the Top 15 holdings in the XLF just in case you were curious.
Components and weightings as of 8/18/10.
| Name | Symbol | Index Weight | |
| 1 | JPMorgan Chase & Co. | JPM | 9.52% |
| 2 | Bank of America Corp. | BAC | 8.44% |
| 3 | Wells Fargo & Co. | WFC | 8.35% |
| 4 | Berkshire Hathaway’B’ | BRK.B | 8.23% |
| 5 | Citigroup Inc. | C | 5.51% |
| 6 | Goldman Sachs Group Inc. | GS | 4.85% |
| 7 | American Express Co. | AXP | 3.16% |
| 8 | U.S. BANCORP | USB | 2.71% |
| 9 | MORGAN STANLEY | MS | 2.32% |
| 10 | MetLife Inc. | MET | 2.23% |
| 11 | Bank of New York Mellon Corp. | BK | 1.92% |
| 12 | PNC Financial Services Group Inc. | PNC | 1.87% |
| 13 | Simon Property Group Inc. | SPG | 1.70% |
| 14 | Prudential Financial Inc. | PRU | 1.63% |
| 15 | Travelers Cos. Inc. | TRV | 1.49% |
Frankly, I did not not know that Berkshire was even in the index let alone the top five, but when you consider his exposure to the insurance sector and his investments in Wells Fargo and Goldman Sachs it makes total sense.
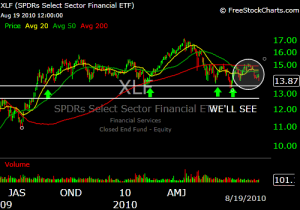
I’ve talked ad nauseum about how the financials needed to take a leadership role to help continue this fledgling rally. I have written about, tweeted about it, I have done video about it (you remember the “banks in a box” by now) and have posted charts about it. Here’s the deal, this will be about the fifth time that XLF has approached support on the daily charts.
We tagged 13.51 low on Feb 5, we tagged 13.84 on May 25, we tagged 13.70 on June 8, 13.84 on July 20. The lowest low we hit though was 13.34 on July 1 and that is the lowest low that we’ve seen in XLF since $13.16 in August 2009.
Yes, I have better things to do than to have just spent 45 minutes looking at all these tedious data points, but it is important. Why? Because if XLF were to break the July 1 low, the market could be in for some tough times. It could of course break it and reverse back up, it will depend on the headlines in the market that day or that week obviously.
Now please remember, we broke support last time and it resulted in move back over $15 and the same could happen again….it just feels different this time. But it always does.
No names tonight as we added a few shorts intraday and took off the last of our longs. There may be a few stragglers, and anything can happen tomorrow, but better to be safe than sorry.

